18 Jul 2024
In the realm of Environmental, Health, and Safety (EHS), the debate between the efficacy of EHS leading versus EHS lagging indicators is ongoing. For EHS professionals, the importance of each type of indicator cannot be overstated, as they play a crucial role in measuring and enhancing workplace safety. We aim to justify the significance of EHS leading indicators, identify valuable Key Performance Indicators (KPIs), and outline how these KPIs can be effectively measured.
EHS Leading Indicators
Leading indicators are proactive measures that predict and prevent incidents before they occur. They are essential for identifying potential hazards and taking corrective actions to mitigate risks. Key leading indicators include:
- Near Miss Reports: These are incidents that could have resulted in injury or damage but did not. Tracking near misses helps identify potential hazards and prevent future incidents.
- Training Completion Rate: The percentage of employees who complete required safety training within a specified timeframe. High training completion rates indicate a well-informed workforce that is better equipped to handle safety issues.
- Behavior Observation Completion Rate: The frequency with which employees' safety behaviors are observed and recorded. Regular behavior observations help reinforce safe practices and identify areas for improvement.
- Safety Inspection Completion Rate: The number of scheduled safety inspections completed. Consistent safety inspections ensure that workplace hazards are identified and addressed promptly.
- Find & Fix Completion Rate: The percentage of identified hazards that are corrected within a specified timeframe. This rate indicates the effectiveness of hazard identification and mitigation processes.
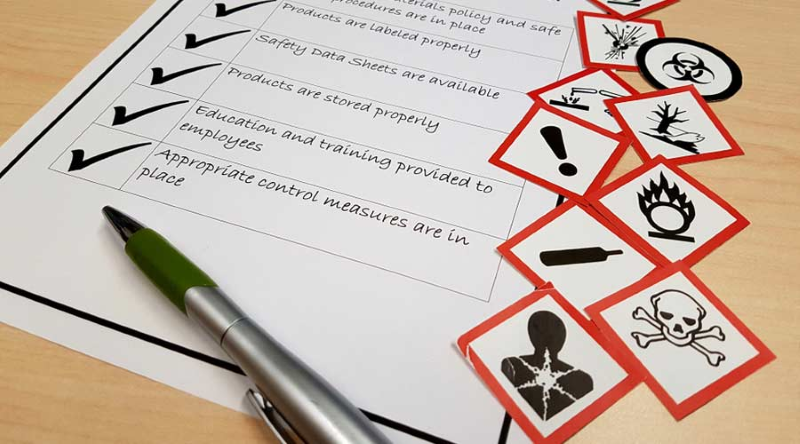
EHS Lagging Indicators
Lagging indicators, on the other hand, measure the outcomes of safety incidents that have already occurred. They are retrospective and help identify trends and areas for improvement. Key EHS lagging indicators include:
- Injury Rate: The frequency of workplace injuries over a given period. Lower injury rates indicate a safer working environment.
- Regulatory Violations: Instances where the workplace fails to comply with safety regulations. Reducing regulatory violations is critical for maintaining compliance and ensuring worker safety.
- Regulatory Fines: Monetary penalties imposed for safety violations. Minimizing fines is essential for controlling costs and improving safety performance.
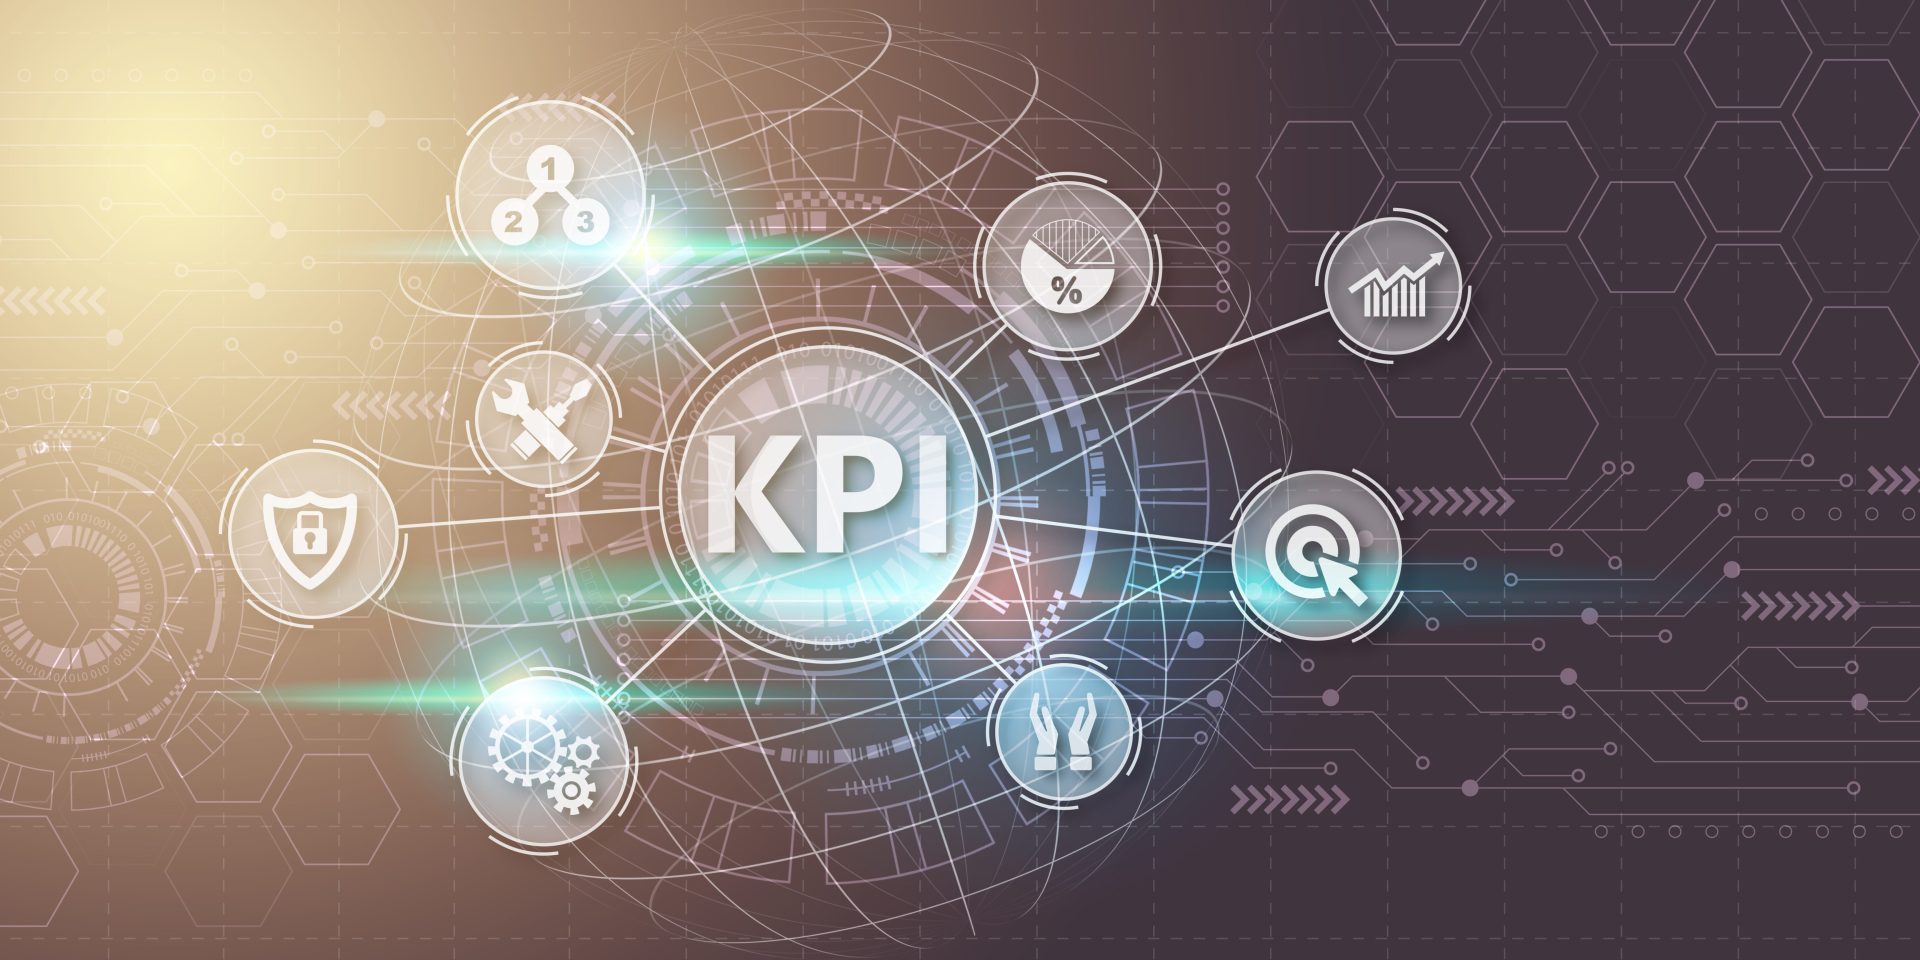
Setting Up and Measuring EHS KPIs
Effective EHS KPIs are crucial for monitoring safety performance and driving improvements. The SMART criteria provide a framework for setting up KPIs:
- Specific: KPIs should be clear and specific, focusing on a particular aspect of safety performance.
- Measurable: KPIs should be quantifiable, allowing for accurate tracking and assessment.
- Achievable: KPIs should be realistic and attainable within the given resources and timeframe.
- Relevant: KPIs should align with organizational safety goals and objectives.
- Time-bound: KPIs should have a defined timeframe for achievement and review.
For example, a KPI for the Training Completion Rate might be: "Achieve a 95% training completion rate for all employees within the next quarter."
EHS Leading Indicators in OSHEPRO’s Applications
1. Employee Training and Engagement
EHS Leading Indicator: Percentage of employees completing safety training modules on time.
- Specific: Tracking the completion rate of mandatory safety training modules by employees.
- Measurable: Measured as a percentage of total employees.
- Accountable: Ensures all employees are adequately trained in safety protocols.
- Reasonable: Setting achievable goals for training completion within a specified timeframe.
- Timely: Monthly tracking to ensure continuous compliance and identify any training gaps promptly.
OSHEPRO’s training module can be highlighted as an essential tool for maintaining high training completion rates. The platform’s ability to send reminders, track progress, and provide easy access to training materials ensures employees stay informed and compliant with safety protocols.
2. Hazard Identification and Response
EHS Leading Indicator: Average time to resolve reported hazards.
- Specific: Measures the time from hazard reporting to resolution.
- Measurable: Recorded in hours or days.
- Accountable: Indicates the efficiency of the hazard management process.
- Reasonable: Goals set based on historical data and resource availability.
- Timely: Continuous monitoring to ensure prompt hazard mitigation.
The platform’s hazard reporting and tracking system can be promoted as a key feature that enhances workplace safety by ensuring quick identification and resolution of hazards. Real-time tracking and notifications enable swift action, preventing potential accidents and improving overall safety.
Benefits of Using Leading Indicators with OSHEPRO
- Preventing Incidents: Leading indicators help identify and mitigate risks before they lead to accidents, fostering a safer work environment. OSHEPRO’s integrated applications support proactive safety management by providing tools for training, hazard reporting, and employee engagement.
- Improving Organizational Performance: By focusing on leading indicators, organizations can enhance their safety programs, resulting in fewer incidents, lower costs, and higher productivity. OSHEPRO’s all-inclusive platform streamlines safety management processes, contributing to overall organizational efficiency.
- Demonstrating Commitment to Safety: Employers using leading indicators showcase their dedication to workplace safety and health. OSHEPRO’s capabilities in this area can supports users looking for reliable and effective safety management solutions.
Utilizing EHS KPIs in OSHEPRO’s Corporate Dashboard
At OSHEPRO, the corporate dashboard prioritizes EHS leading indicators to drive proactive safety management. EHS leading indicators, such as Near Miss Reports and Training Completion Rates, are displayed prominently at the top of the dashboard. This setup ensures that the focus remains on preventing incidents rather than merely reacting to them. The injury chart at the bottom provides a retrospective view, allowing for trend analysis and continuous improvement.
By consistently tracking and analyzing these KPIs, organizations can create a safer workplace, reduce incidents, and achieve compliance with safety regulations. EHS leading indicators, when effectively measured and managed, pave the way for a proactive safety culture that values prevention over reaction.


.png)


.png)

.png)


.jpg)